
Die Anvil's Storage Utilities sind kostenlos erhältlich und eignen sich sowohl für Benchmarks auf modernen SSDs als auch auf herkömmlichen magnetischen Speichern (HDDs). Die Freeware misst nicht nur die Lese- und Schreibtransferraten in bis zu sechs verschiedenen Clustergrößen, sondern auch die Anzahl der Ein- und Ausgabebefehle, die das Laufwerk pro Sekunde abarbeiten kann (IOPS). Für unsere Tests haben wir die sequentiellen Datenraten sowie IOPS ermittelt. Zudem mussten die Testprobanden bei kleineren 4K-Blöcken und bei erweiterter Anfragetiefe (QD16) ihr Können unter Beweis stellen.
| Transferrate, Lesen, Mittelwert | |
| Intel SSD 750 Series, 1.2 TB (PCIe 3.0 x4) | 2.151,26 |
| Kingston HyperX Predator, 480 GB (PCIe 2.0 x4) | 1.287,24 |
| Plextor M6e Black, 256 GB (PCIe 2.0 x2) | 721,13 |
| OCZ TR150, 480 GB | 531,53 |
| Plextor M6V, 256 GB | 529,34 |
| OCZ Trion 100, 960 GB | 527,29 |
| OCZ Vector 180, 240 GB | 527,21 |
| ZOTAC Premium SSD, 240 GB | 527,16 |
| Plextor M7V, 256 GB | 527,16 |
| Toshiba Q300, 240 GB | 525,13 |
| Kingston HyperX Savage SSD, 480 GB | 525,13 |
| Toshiba Q300 Pro, 256 GB | 520,99 |
| Toshiba Q300 Pro, 128 GB | 520,99 |
| Toshiba Q-Series Pro, 256 GB | 520,99 |
| Angaben in MB/sec (mehr ist besser) | |
| Transferrate, Schreiben, Mittelwert | |
| Intel SSD 750 Series, 1.2 TB (PCIe 3.0 x4) | 1.216,15 |
| Kingston HyperX Predator, 480 GB (PCIe 2.0 x4) | 585,81 |
| Plextor M6e Black, 256 GB (PCIe 2.0 x2) | 551,72 |
| Kingston HyperX Savage SSD, 480 GB | 500,98 |
| OCZ TR150, 480 GB | 497,33 |
| ZOTAC Premium SSD, 240 GB | 497,09 |
| Plextor M7V, 256 GB | 489,95 |
| OCZ Vector 180, 240 GB | 478,95 |
| Toshiba Q-Series Pro, 256 GB | 472,11 |
| Toshiba Q300 Pro, 256 GB | 465,45 |
| Toshiba Q300 Pro, 128 GB | 465,45 |
| OCZ Trion 100, 960 GB | 449,71 |
| Plextor M6V, 256 GB | 341,90 |
| Toshiba Q300, 240 GB | 154,08 |
| Angaben in MB/sec (mehr ist besser) | |
| Zugriffe, Lesen, Mittelwert | |
| Intel SSD 750 Series, 1.2 TB (PCIe 3.0 x4) | 537 |
| Kingston HyperX Predator, 480 GB (PCIe 2.0 x4) | 322 |
| Plextor M6e Black, 256 GB (PCIe 2.0 x2) | 180 |
| OCZ TR150, 480 GB | 133 |
| ZOTAC Premium SSD, 240 GB | 132 |
| Plextor M6V, 256 GB | 132 |
| OCZ Trion 100, 960 GB | 132 |
| Plextor M7V, 256 GB | 132 |
| Toshiba Q300, 240 GB | 131 |
| Kingston HyperX Savage SSD, 480 GB | 131 |
| Toshiba Q300 Pro, 256 GB | 130 |
| Toshiba Q300 Pro, 128 GB | 130 |
| Toshiba Q-Series Pro, 256 GB | 130 |
| OCZ Vector 180, 240 GB | 124 |
| Angaben in IOPS (mehr ist besser) | |
| Zugriffe, Schreiben, Mittelwert | |
| Intel SSD 750 Series, 1.2 TB (PCIe 3.0 x4) | 304 |
| Kingston HyperX Predator, 480 GB (PCIe 2.0 x4) | 147 |
| Plextor M6e Black, 256 GB (PCIe 2.0 x2) | 137 |
| Kingston HyperX Savage SSD, 480 GB | 125 |
| ZOTAC Premium SSD, 240 GB | 124 |
| OCZ TR150, 480 GB | 124 |
| Plextor M7V, 256 GB | 122 |
| OCZ Vector 180, 240 GB | 119 |
| Toshiba Q-Series Pro, 256 GB | 118 |
| Toshiba Q300 Pro, 256 GB | 116 |
| Toshiba Q300 Pro, 128 GB | 116 |
| OCZ Trion 100, 960 GB | 112 |
| Plextor M6V, 256 GB | 86 |
| Toshiba Q300, 240 GB | 38 |
| Angaben in IOPS (mehr ist besser) | |
| Transferrate, Lesen, Mittelwert | |
| Intel SSD 750 Series, 1.2 TB (PCIe 3.0 x4) | 42,96 |
| Plextor M7V, 256 GB | 42,67 |
| ZOTAC Premium SSD, 240 GB | 40,26 |
| OCZ Vector 180, 240 GB | 39,48 |
| Kingston HyperX Predator, 480 GB (PCIe 2.0 x4) | 38,54 |
| Plextor M6V, 256 GB | 38,01 |
| Plextor M6e Black, 256 GB (PCIe 2.0 x2) | 35,68 |
| Kingston HyperX Savage SSD, 480 GB | 34,55 |
| OCZ TR150, 480 GB | 33,89 |
| Toshiba Q300, 240 GB | 33,17 |
| OCZ Trion 100, 960 GB | 33,01 |
| Toshiba Q-Series Pro, 256 GB | 24,89 |
| Toshiba Q300 Pro, 256 GB | 24,84 |
| Toshiba Q300 Pro, 128 GB | 24,05 |
| Angaben in MB/sec (mehr ist besser) | |
| Transferrate, Schreiben, Mittelwert | |
| OCZ Vector 180, 240 GB | 147,38 |
| Toshiba Q300 Pro, 256 GB | 133,97 |
| Plextor M6V, 256 GB | 133,37 |
| Kingston HyperX Savage SSD, 480 GB | 131,42 |
| Toshiba Q300 Pro, 128 GB | 130,71 |
| Toshiba Q-Series Pro, 256 GB | 129,64 |
| ZOTAC Premium SSD, 240 GB | 122,54 |
| OCZ Trion 100, 960 GB | 121,91 |
| OCZ TR150, 480 GB | 114,65 |
| Kingston HyperX Predator, 480 GB (PCIe 2.0 x4) | 108,65 |
| Plextor M6e Black, 256 GB (PCIe 2.0 x2) | 101,46 |
| Plextor M7V, 256 GB | 98,37 |
| Intel SSD 750 Series, 1.2 TB (PCIe 3.0 x4) | 95,37 |
| Toshiba Q300, 240 GB | 87,38 |
| Angaben in MB/sec (mehr ist besser) | |
| Zugriffe, Lesen, Mittelwert | |
| Intel SSD 750 Series, 1.2 TB (PCIe 3.0 x4) | 10.997 |
| Plextor M7V, 256 GB | 10.924 |
| ZOTAC Premium SSD, 240 GB | 10.305 |
| Kingston HyperX Predator, 480 GB (PCIe 2.0 x4) | 9.866 |
| Plextor M6V, 256 GB | 9.731 |
| OCZ Vector 180, 240 GB | 9.545 |
| Plextor M6e Black, 256 GB (PCIe 2.0 x2) | 9.134 |
| Kingston HyperX Savage SSD, 480 GB | 8.844 |
| OCZ TR150, 480 GB | 8.674 |
| Toshiba Q300, 240 GB | 8.492 |
| OCZ Trion 100, 960 GB | 8.451 |
| Toshiba Q-Series Pro, 256 GB | 6.373 |
| Toshiba Q300 Pro, 256 GB | 6.359 |
| Toshiba Q300 Pro, 128 GB | 6.158 |
| Angaben in IOPS (mehr ist besser) | |
| Zugriffe, Schreiben, Mittelwert | |
| OCZ Vector 180, 240 GB | 37.728 |
| Toshiba Q300 Pro, 256 GB | 34.296 |
| Plextor M6V, 256 GB | 34.143 |
| Kingston HyperX Savage SSD, 480 GB | 33.642 |
| Toshiba Q300 Pro, 128 GB | 33.461 |
| Toshiba Q-Series Pro, 256 GB | 33.188 |
| ZOTAC Premium SSD, 240 GB | 31.369 |
| OCZ Trion 100, 960 GB | 31.208 |
| OCZ TR150, 480 GB | 29.350 |
| Kingston HyperX Predator, 480 GB (PCIe 2.0 x4) | 27.815 |
| Plextor M6e Black, 256 GB (PCIe 2.0 x2) | 25.973 |
| Plextor M7V, 256 GB | 25.182 |
| Intel SSD 750 Series, 1.2 TB (PCIe 3.0 x4) | 24.415 |
| Toshiba Q300, 240 GB | 22.368 |
| Angaben in IOPS (mehr ist besser) | |
| Transferrate, Lesen, Mittelwert | |
| Intel SSD 750 Series, 1.2 TB (PCIe 3.0 x4) | 577,00 |
| OCZ Vector 180, 240 GB | 349,81 |
| ZOTAC Premium SSD, 240 GB | 344,38 |
| Plextor M6e Black, 256 GB (PCIe 2.0 x2) | 314,18 |
| Kingston HyperX Predator, 480 GB (PCIe 2.0 x4) | 307,47 |
| Toshiba Q300 Pro, 256 GB | 302,62 |
| Toshiba Q-Series Pro, 256 GB | 299,14 |
| Kingston HyperX Savage SSD, 480 GB | 298,61 |
| OCZ TR150, 480 GB | 298,27 |
| Toshiba Q300, 240 GB | 291,25 |
| OCZ Trion 100, 960 GB | 289,91 |
| Plextor M7V, 256 GB | 283,11 |
| Toshiba Q300 Pro, 128 GB | 277,86 |
| Plextor M6V, 256 GB | 272,96 |
| Angaben in MB/sec (mehr ist besser) | |
| Transferrate, Schreiben, Mittelwert | |
| Intel SSD 750 Series, 1.2 TB (PCIe 3.0 x4) | 1.131,36 |
| Kingston HyperX Savage SSD, 480 GB | 343,26 |
| OCZ Vector 180, 240 GB | 342,63 |
| Plextor M6e Black, 256 GB (PCIe 2.0 x2) | 331,44 |
| ZOTAC Premium SSD, 240 GB | 326,00 |
| Plextor M7V, 256 GB | 320,23 |
| Kingston HyperX Predator, 480 GB (PCIe 2.0 x4) | 318,83 |
| OCZ TR150, 480 GB | 297,01 |
| Plextor M6V, 256 GB | 287,03 |
| OCZ Trion 100, 960 GB | 266,39 |
| Toshiba Q300 Pro, 256 GB | 240,34 |
| Toshiba Q-Series Pro, 256 GB | 236,62 |
| Toshiba Q300 Pro, 128 GB | 206,48 |
| Toshiba Q300, 240 GB | 140,54 |
| Angaben in MB/sec (mehr ist besser) | |
| Zugriffe, Lesen, Mittelwert | |
| Intel SSD 750 Series, 1.2 TB (PCIe 3.0 x4) | 147.711 |
| ZOTAC Premium SSD, 240 GB | 88.161 |
| OCZ Vector 180, 240 GB | 83.950 |
| Plextor M6e Black, 256 GB (PCIe 2.0 x2) | 80.431 |
| Kingston HyperX Predator, 480 GB (PCIe 2.0 x4) | 78.711 |
| Toshiba Q300 Pro, 256 GB | 77.471 |
| Toshiba Q-Series Pro, 256 GB | 76.580 |
| Kingston HyperX Savage SSD, 480 GB | 76.444 |
| OCZ TR150, 480 GB | 76.356 |
| Toshiba Q300, 240 GB | 74.559 |
| OCZ Trion 100, 960 GB | 74.217 |
| Plextor M7V, 256 GB | 72.475 |
| Toshiba Q300 Pro, 128 GB | 71.131 |
| Plextor M6V, 256 GB | 69.878 |
| Angaben in IOPS (mehr ist besser) | |
| Zugriffe, Schreiben, Mittelwert | |
| Intel SSD 750 Series, 1.2 TB (PCIe 3.0 x4) | 289.628 |
| Kingston HyperX Savage SSD, 480 GB | 87.874 |
| OCZ Vector 180, 240 GB | 87.712 |
| Plextor M6e Black, 256 GB (PCIe 2.0 x2) | 84.848 |
| ZOTAC Premium SSD, 240 GB | 83.457 |
| Plextor M7V, 256 GB | 81.980 |
| Kingston HyperX Predator, 480 GB (PCIe 2.0 x4) | 81.621 |
| OCZ TR150, 480 GB | 76.035 |
| Plextor M6V, 256 GB | 73.480 |
| OCZ Trion 100, 960 GB | 68.195 |
| Toshiba Q300 Pro, 256 GB | 61.527 |
| Toshiba Q-Series Pro, 256 GB | 60.575 |
| Toshiba Q300 Pro, 128 GB | 52.859 |
| Toshiba Q300, 240 GB | 35.979 |
| Angaben in IOPS (mehr ist besser) | |
Im zurückliegenden Monat gab es wieder einige spannende Themen im Bereich Newsmeldungen sowie interessante Artikel und Produkttests. Folgend möchten wir...
Mit der SanDisk Professional G-RAID PROJECT 2 positioniert SanDisk ein 2-Bay-Desktop-RAID für professionelle Medien- und Produktionsumgebungen. Das System ist mit...
Ein vernetztes Zuhause galt kürzlich noch als Spielerei. Smarte Thermostate, Sprachsteuerung und automatisierte Rollläden sind heute in vielen Haushalten üblich....
SanDisk kündigt die nächste Generation seines externen SSD-Portfolios an und stellt eine neu entwickelte dreistufige Produktreihe vor. Das Portfolio umfasst...
Künstliche Intelligenz revolutioniert gerade die Videoüberwachung und erschließt ihr ganz neue Anwendungsbereiche. In der Fertigung lassen sich KI-basierte Videoanalysen beispielsweise...
Das G-RAID PROJECT 2 ist ein 2-Bay Storage-System für Profis und bietet eine Thunderbolt-Schnittstelle inkl. hoher Speicherkapazitäten. Wir haben das 48-TB-Modell getestet.
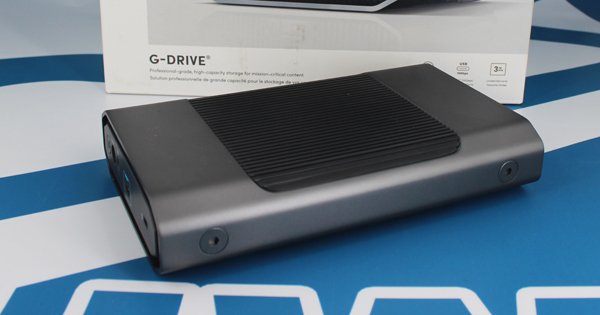
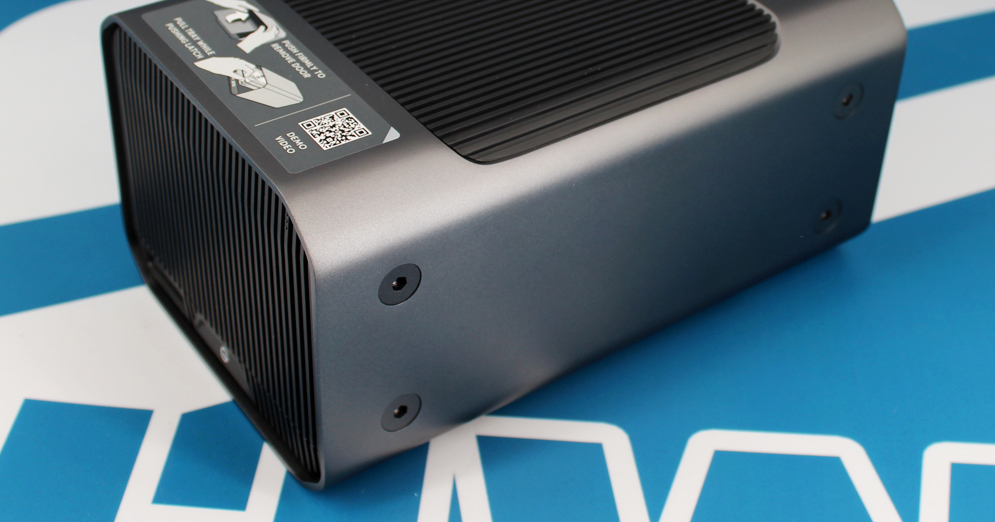
Mit dem SanDisk Professional G-DRIVE bietet Western Digital eine externe HDD für Profis an. Der mobile Speicher bietet bis zu 26 TB Platz für Inhalte und ist mit einem USB-C-Interface ausgestattet.
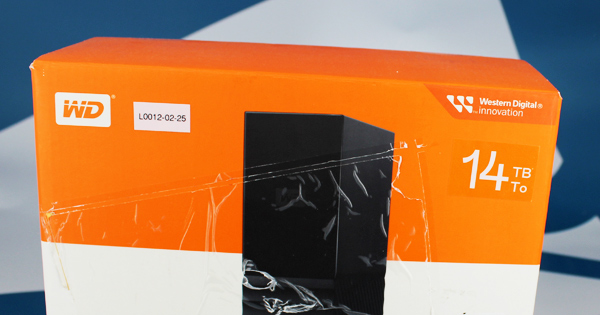
Die My Book-Festplatte von Western Digital dient als großzügiger Desktopspeicher mit bis zu 26 TB und ermöglicht das lokale Sichern großer Datenmengen. Wir haben uns das Modell mit 14 TB im Test angesehen.